The Fishbone Diagram | Root Cause Analysis | Cause and Effect Diagram
One of the Business Analyst’s challenges in projects can be working out the root cause of a particular problem or business need. Your stakeholders would often be ready with a solution to a perceived problem without necessarily understanding where the cause of the problem or business need originates from. The Fishbone Diagram is a very effective yet simple technique to apply when doing a root cause analysis of a particular effect (the problem experienced). This technique helps the Business Analyst to determine where a particular need or problem originates from by illustrating this visually and considering different aspects systematically using this diagram. This in turn helps to identify how to solve for what is causing the problem or business need in the first place.
Example Scenario: Root Cause Analysis using a Fishbone Diagram
An example of this type of scenario can be consider here as follows: It could be that a stakeholder is coming to you with a request to implement a new call center management system because they are experiencing a higher number of customer complaints and they believe (rightly or wrongly) a new system will solve this problem. The stakeholder believes that their current system cannot handle all the calls coming in, in a reasonable time frame. This is when as a Business Analyst, you may then use the Fishbone Diagram to analyse (with your stakeholder) the different causes of this problem of higher customer complaints.
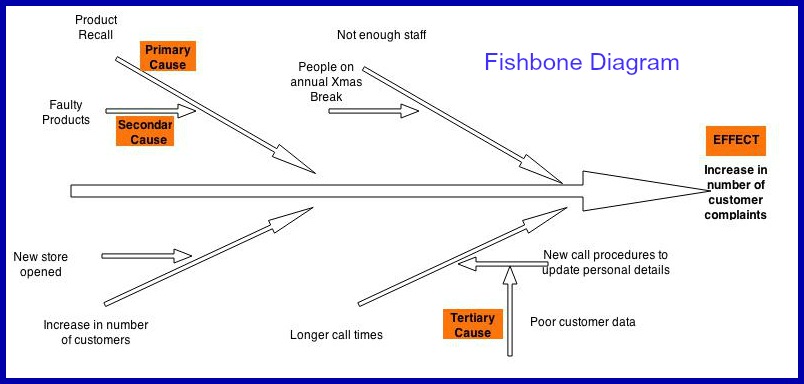
Various different causes or reasons for this perceived problem might be identified through discussion and workshops. After discussing the possible causes you might decide that one of the main causes is the recent change to the way a customer accesses their online self service portal is adding an additional number of customer queries to the call center workload every day.
You might also identify that the recently implemented call center procedures for capturing call information is taking much longer than before. This in turn might be because the new manager of the call center is now expecting call center staff to also update any changed personal details for every person that calls.
So the duration of each call has increase from 1 minute on average to 4 minutes on average. Considering the new product that was recently launched by the company has a fault associated with it could also be a reason for the increase in call volumes. You should explore all these potential reasons with the stakeholder by using your Business Analysis questioning skills and using the Fishbone Diagram get to the real root cause of why the stakeholders are experiencing the perceived problem of increased customer complaints.
The end result is that both you as the Business Analyst and the stakeholder will have a clear view of the overall causes of the current problem which may aid in then deciding if the root cause is really the system not being able to handle a large number of calls or instead the root cause is a combination of one or two of the other causes identified. This will then help you communicate and establish the true requirements for solving the problem the stakeholder is experiencing. As you would have guessed by now, it may be something completely different than what the stakeholder suggested originally!
Tip for when performing a Root Cause Analysis
A general tip to Business Analysts when using the Fishbone Diagram is to keep this diagram in the back of your mind when you ask questions about business problems and needs being raised. You can create a mental Fishbone Diagram “on the fly” as you get more experienced and get the bottom of what is the real need or requirement that a stakeholder might be describing on the surface to you. This is a great technique to use when honing your requirements elicitation skills!